Week of feb 14

This week I decided to do spacial visualization on a smaller species of plant. A couple weeks ago I did the same thing to the second most number of plant species. This was the result.

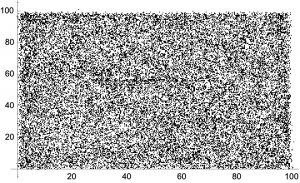
This was the result of doing the same visualization on the plant species “parodychia jamesii”

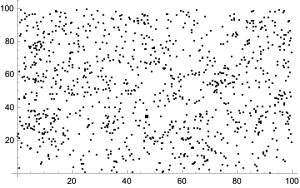
We can see that there is less data points, which reveals that the way the plants are positioned is not random. It got a chi squared statistic of 0, which means the way the plants are positioned is not random.

Week of feb 7

This week I didn’t make a lot of progress. I would have liked to do a visualization on a species with less numbers of instances. I have done visualizations on the biggest and second biggest species and have gotten inconclusive results. If I did the same procedures on a smaller species maybe I would get better results.

week of jan 31

In class we learned how to test for complete spacial randomness with the plant species with the largest amount of plants. I wanted to do this with another plant species. I took the second largest plant species and I plotted all the occurrences of the plant.

At first glance this looks random. Lets see if it is distributed randomly. To do this we need to test for a homogeneous Poisson distribution. I divided up the model into 10,000 pieces and check for the chi squared statistic. I got a chi squared probability of 1.9 * 10^-57, a very small probability. The data fits a Poisson distribution very poorly.