This week I decided to replicate what we learned in the PPI network lecture. I first loaded the protein to protein data into Mathematica, (after great difficulty unzipping the file). After I imported the data I made a graph.
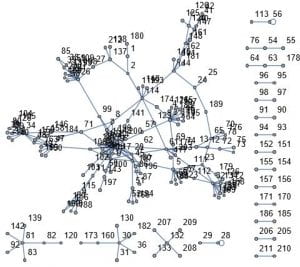
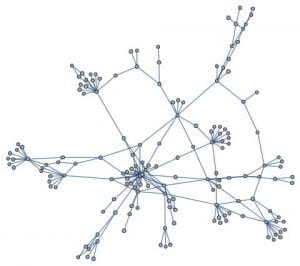
This is a graph of all the connections between the various proteins. We can see that there appears to be some clusters. One big cluster and several smaller clusters. We should plot the bigger cluster separately on another graph.
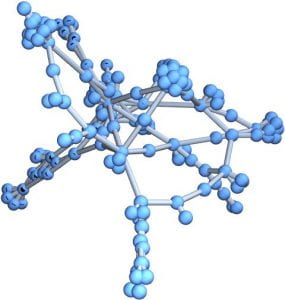
Here is a 3d version of the same graph.
Next week I would like to do something similar but with another PPI dataset.

Just another UMassD WordPress site